https://xelta.ai/models/image_generation/stable-image-ultra-workflow
Tested 2026-10-06 09:12:43 using Chrome 150.0.7871.46 (runtime settings)
This page is visually stable and follows best practices, but slow to paint, a little janky to interact with, weak on user privacy, slow to respond from the server and heavy to download.


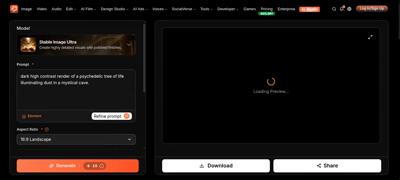
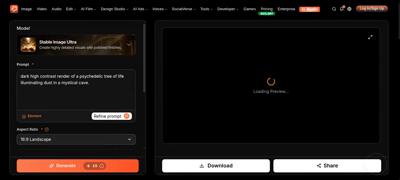

Visual metrics
Google Web Vitals
The page has 19 images that are scaled more than 100 pixels. It would be better if those images are sent so the browser don't need to scale them.
The page is using Google Tag Manager, this is a performance risk since non-tech users can add JavaScript to your page.
The page has 16 CPU long tasks with the total of 1.216 s. The total blocking time is 415 ms and 1 long task before first contentful paint with total time of 51 ms. However the CPU Long Task is depending on the computer/phones actual CPU speed, so you should measure this on the same type of the device that your user is using. Use Geckoprofiler for Firefox or Chromes tracelog to debug your long tasks.
Timings summary
| Metric | Min | Median | Mean | Max |
|---|---|---|---|---|
| First visual change | 1.103 s | 1.103 s | 1.103 s | 1.103 s |
| Last visual change | 6.585 s | 6.585 s | 6.585 s | 6.585 s |
| Speed index | 3.162 s | 3.162 s | 3.162 s | 3.162 s |
| Visual readiness | 5.482 s | 5.482 s | 5.482 s | 5.482 s |
| Visual complete 85 | 6.318 s | 6.318 s | 6.318 s | 6.318 s |
| Visual complete 95 | 6.452 s | 6.452 s | 6.452 s | 6.452 s |
| Visual complete 99 | 6.585 s | 6.585 s | 6.585 s | 6.585 s |
Run 1 SpeedIndex median