Tested 2026-07-30 19:02:08 using Chrome 150.0.7871.186 (runtime settings)
This page is fast to paint, snappy to interact with, visually stable, follows best practices and privacy-respecting.



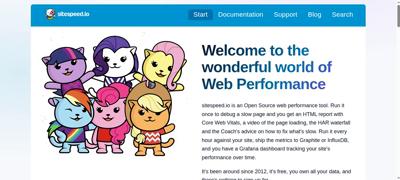
Visual metrics
Google Web Vitals
The page has 2 CPU long tasks with the total of 153 ms. The total blocking time is 23 ms and 1 long task before first contentful paint with total time of 80 ms. However the CPU Long Task is depending on the computer/phones actual CPU speed, so you should measure this on the same type of the device that your user is using. Use Geckoprofiler for Firefox or Chromes tracelog to debug your long tasks.
Timings summary
| Metric | Min | Median | Mean | Max | Runs agree? |
|---|---|---|---|---|---|
| First visual change | 467 ms | 500 ms | 656 ms | 1.000 s | runs disagree ±53% |
| Last visual change | 600 ms | 633 ms | 822 ms | 1.233 s | runs disagree ±50% |
| Speed index | 528 ms | 561 ms | 730 ms | 1.102 s | runs disagree ±51% |
| Visual readiness | 133 ms | 133 ms | 166 ms | 233 ms | runs disagree ±38% |
| Visual complete 85 | 600 ms | 633 ms | 822 ms | 1.233 s | runs disagree ±50% |
| Visual complete 95 | 600 ms | 633 ms | 822 ms | 1.233 s | runs disagree ±50% |
| Visual complete 99 | 600 ms | 633 ms | 822 ms | 1.233 s | runs disagree ±50% |
Run 2 SpeedIndex median
The red band on the timeline marks when the main thread was busy with long tasks: moments when the page could not paint or respond, however the video looks.
Download videoUse --filmstrip.showAll to show all filmstrips.
Click a frame to seek the video to that moment. The dot marks frames where the page changed visually.
Rendering was not meaningfully delayed. First paint landed at 480 ms on a 204 ms first byte; the 1 render-blocking request was done by 349 ms and the remaining ~131 ms is style and layout work. The largest paint followed at 598 ms.
Want to see how much CSS style-recalculation work delayed FCP and LCP, plus CPU long tasks? Run with --cpu.
Blocking requests delay both paints: the browser renders nothing until they arrive, so they push First Contentful Paint and everything after it, including the largest paint (LCP). Requests that block the parser inside the body stall everything after them in the document. Load JavaScript with defer or async, and keep non-critical CSS off the critical path with media attributes. Bars show when each request loaded on a clock that runs to the last paint (the dashed line is FCP, the clock ends at LCP); the gap after the bars is style and layout work.
| Request | When it loaded | Transfer | Download |
|---|---|---|---|
document | 197 ms | 6.1 KB | 196 ms |
NpD8aMgW5S.cssblocking | 73 ms | 5.9 KB | 73 ms |
user-timing-header.jsblocks parser in body | 75 ms | 224 B | 75 ms |
LCP resource | 130 ms | 34.4 KB | 130 ms |
0150 ms299 msFCP 480 msLCP 598 ms |
The coach helps you find performance problems on your web page using web performance best practice rules. And gives you advice on privacy and best practices. Tested using Coach-core version 9.2.1.
longTasksThe page has 2 CPU long tasks with the total of 153 ms. The total blocking time is 23 ms and 1 long task before first contentful paint with total time of 80 ms. However the CPU Long Task is depending on the computer/phones actual CPU speed, so you should measure this on the same type of the device that your user is using. Use Geckoprofiler for Firefox or Chromes tracelog to debug your long tasks.
Long CPU tasks locks the thread. To the user this is commonly visible as a "locked up" page where the browser is unable to respond to user input; this is a major source of bad user experience on the web today. However the CPU Long Task is depending on the computer/phones actual CPU speed, so you should measure this on the same type of the device that your user is using. To debug you should use the Chrome timeline log and drag/drop it into devtools or use Firefox Geckoprofiler.
unnecessaryHeadersThere are 9 responses that sets a server header.
Do not send headers that you don't need. We look for p3p, cache-control and max-age, pragma, server and x-frame-options headers. Have a look at Andrew Betts - Headers for Hackers talk as a guide https://www.youtube.com/watch?v=k92ZbrY815c or read https://www.fastly.com/blog/headers-we-dont-want.
nelHeaderSet a NEL header (paired with Reporting-Endpoints) to collect connection-level error reports from the field.
The NEL (Network Error Logging) response header tells the browser to record connection-level failures (DNS, TLS, HTTP errors) and ship them to a reporting endpoint. NEL pairs with the Reporting-Endpoints / Report-To header — the page declares the endpoint group and NEL points at it. Together they give you visibility into errors that never reach your origin server. https://developer.mozilla.org/en-US/docs/Web/HTTP/Headers/NEL
reportingEndpointsHeaderSet a Reporting-Endpoints header (or the legacy Report-To header) so CSP reports, NEL data and other Reporting-API events have an endpoint to land at.
The Reporting-Endpoints response header (the successor to Report-To) names the URLs that browsers should POST reports to. Without it, CSP report-to directives, Cross-Origin-Opener-Policy reports, NEL data and other Reporting-API events have nowhere to go. The legacy Report-To header is still accepted for older Chromium versions. https://developer.mozilla.org/en-US/docs/Web/HTTP/Headers/Reporting-Endpoints
A snapshot of what the browser actually built for this page: the document, how big and deep the DOM tree is and what it kept in storage. Big, deep trees are slower to style and lay out, so the counts Chrome warns about carry a flag.
Document
What the page says it is and how large it rendered.
DOM structure
How much markup the browser has to build, style and lay out.
What the page stored on the client, and the network it was tested on.
Data collected using
Coach-core version 9.2.1. With updated code from
Webappanalyzer 2026-05-04. Use
--browsertime.firefox.includeResponseBodies html or
--browsertime.chrome.includeResponseBodies html to help Wappalyzer find more information about technologies used.
Data from run 2
0.0s0.4s0.5s0.6s0.7sWhen the page main content is rendered, collected via the Largest Contentful Paint API. Read more about Largest Contentful Paint.
body > main > div:eq(0) > div > div:eq(0) > picture > img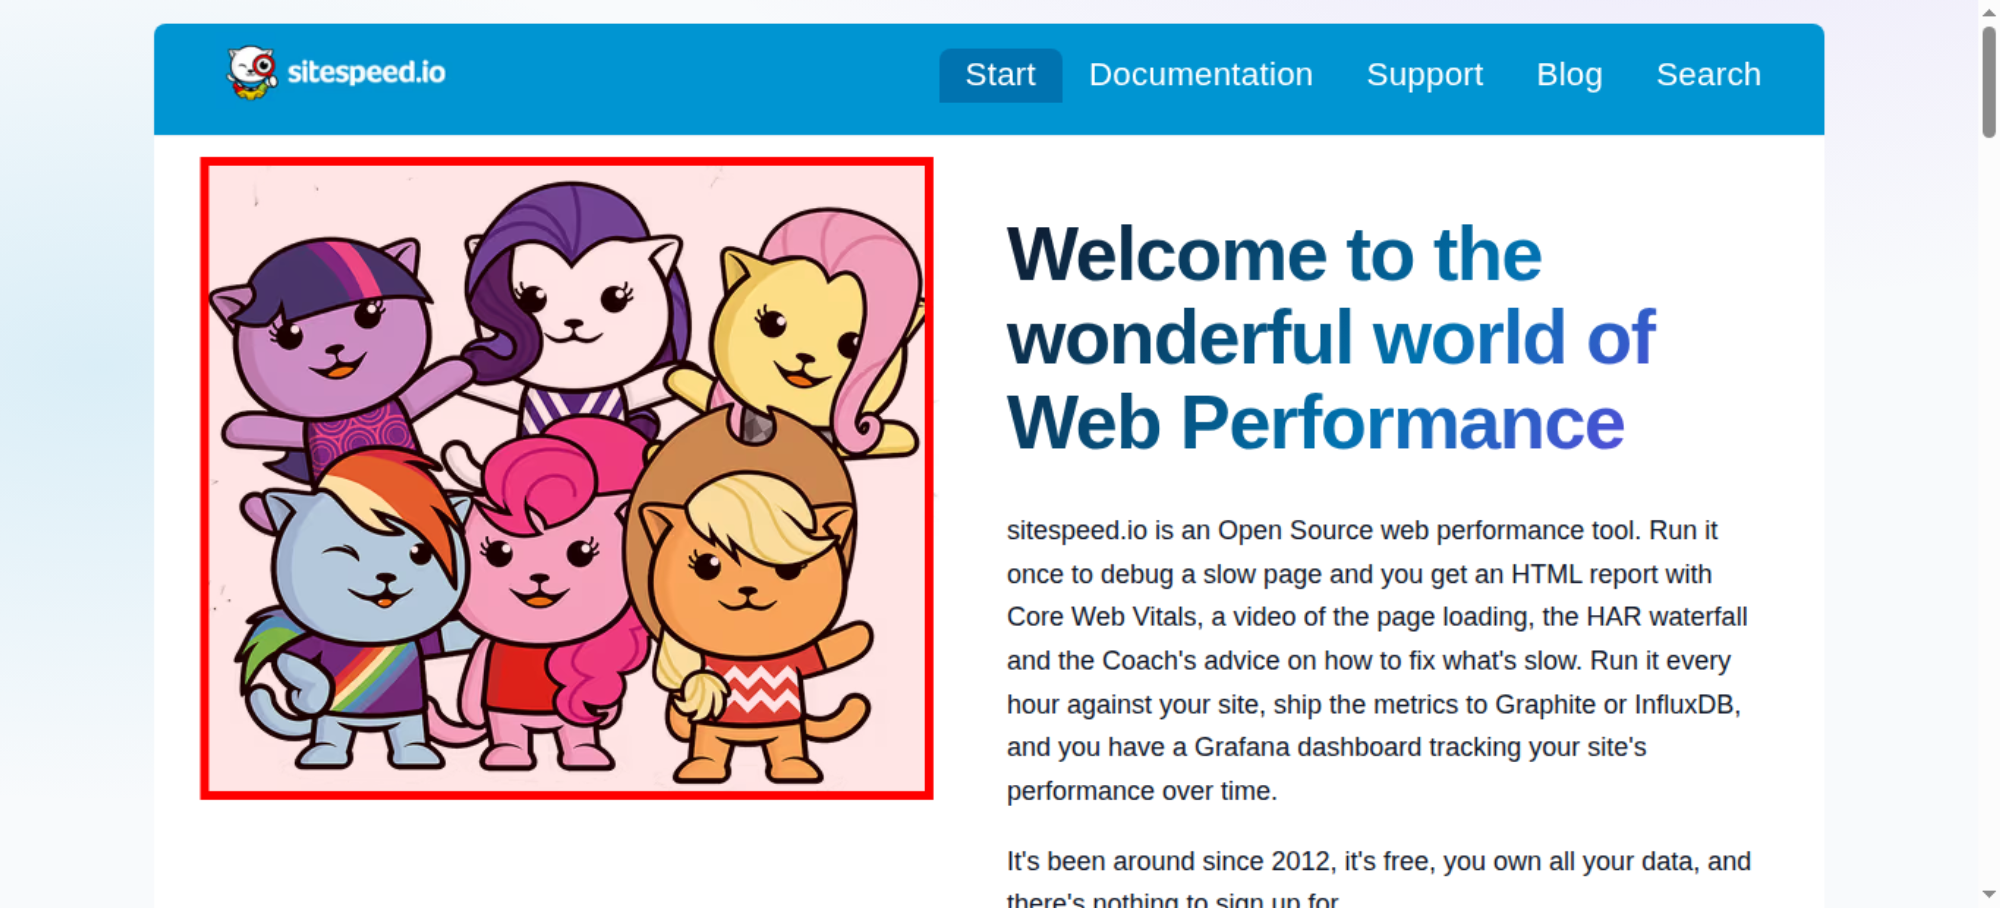
The LCP element is highlighted in the screenshot. If nothing is highlighted the element was removed before the screenshot or the LCP API couldn't find it.
The Largest Contentful Paint API matched this image:

How much the page's content shifts as it loads, collected via the Cumulative Layout Shift API.
No layout shifts were detected on this page.

There are no custom configured scripts.
There are no custom extra metrics from scripting.
How the page is built.
| Header | Value |
|---|---|
accept-ranges | bytes |
age | 10037 |
cache-control | public,max-age=0,must-revalidate,no-transform |
cache-status | "Netlify Edge"; hit |
content-encoding | br |
content-length | 5610 |
content-security-policy | default-src 'self'; script-src 'self' 'wasm-unsafe-eval'; style-src 'self'; img-src 'self' data:; object-src 'none'; base-uri 'self'; frame-ancestors 'self' |
content-type | text/html; charset=UTF-8 |
cross-origin-embedder-policy | require-corp |
cross-origin-opener-policy | same-origin |
cross-origin-resource-policy | same-origin |
date | Thu, 30 Jul 2026 19:02:36 GMT |
etag | "651b72cff08aef13e551bbd7a84a7d36-ssl-df" |
permissions-policy | interest-cohort=() |
referrer-policy | no-referrer |
server | Netlify |
strict-transport-security | max-age=31536000; includeSubDomains |
vary | Accept-Encoding |
x-content-type-options | nosniff |
x-nf-request-id | 01KYT6GDGCYGSFAZTC1HT5SSDD |
x-xss-protection | 1; mode=block |
| URL | Type | Transfer Size | Content Size |
|---|---|---|---|
| https://www.sitespee...8bRaVGAJ-500.avif | image | 34.4 KB | 34.2 KB |
| https://www.sitespee...5LbaEznK-180.avif | image | 6.9 KB | 6.8 KB |
| https://www.sitespeed.io/ | html | 6.1 KB | 24.7 KB |
| https://www.sitespee...ss/NpD8aMgW5S.css | css | 5.8 KB | 26.7 KB |
| https://www.sitespee.../sitespeed.io.ico | favicon | 2.9 KB | 6.4 KB |
| https://www.sitespee...W60XTv4C-200.avif | image | 2.3 KB | 2.2 KB |
| https://www.sitespeed.io/js/copy.js | javascript | 785 B | 1.7 KB |
| https://www.sitespee...-timing-footer.js | javascript | 289 B | 194 B |
| https://www.sitespee...-timing-header.js | javascript | 196 B | 102 B |
Transfer size59.6 KB
Content size102.9 KB
Requests9
| Content | Header Size | Transfer Size | Content Size | Requests |
|---|---|---|---|---|
| html | 0 b | 6.1 KB | 24.7 KB | 1 |
| css | 0 b | 5.8 KB | 26.7 KB | 1 |
| javascript | 0 b | 1.2 KB | 1.9 KB | 3 |
| image | 0 b | 43.6 KB | 43.2 KB | 3 |
| favicon | 0 b | 2.9 KB | 6.4 KB | 1 |
| Total | 0 b | 59.6 KB | 102.9 KB | 9 |
| Domain | Total download time | Transfer Size | Content Size | Requests |
|---|---|---|---|---|
| www.sitespeed.io | 3.060 s | 59.6 KB | 102.9 KB | 9 |
| type | min | median | max |
|---|---|---|---|
| Expires | 0 seconds | 1 year | 1 year |
Includes requests done after load event end.
| Content | Transfer Size | Requests |
|---|---|---|
| html | 0 b | 0 |
| css | 0 b | 0 |
| javascript | 0 b | 0 |
| image | 0 b | 0 |
| font | 0 b | 0 |
| favicon | 2.9 KB | 1 |
| Total | 2.9 KB | 1 |
Includes requests done after DOM content loaded.
| Content | Transfer Size | Requests |
|---|---|---|
| html | 0 b | 0 |
| css | 0 b | 0 |
| javascript | 0 b | 0 |
| image | 0 b | 0 |
| font | 0 b | 0 |
| favicon | 2.9 KB | 1 |
| Total | 2.9 KB | 1 |
--enableProfileRun to see where main-thread time went, blocking time and CPU cost per script, module and function, forced reflows and frame stability. The data is collected in one extra run, so the timing metrics of your measured runs stay untouched.Tasks ≥ 50 ms blocking the main thread, collected via the Long Task API.
A long animation frame (LOAF) is a frame that took ≥ 50 ms from input to the next paint. The part beyond the threshold is blocking time, the number that hurts Interaction to Next Paint and Total Blocking Time. Break long tasks up (scheduler.yield(), smaller chunks) or move the work off the main thread. Read more about the Long Animation Frames API.
The browser did not report which script was responsible for this frame — typically its own style/layout work, or a cross-origin script it will not name.
1 more long frame carried no blocking time (nothing ran past the 50 ms threshold) — long, but harmless to INP and TBT.
Third party requests categorised by Third party web version 0.29.2.
No third-party requests detected
Every request on this page resolved to a first-party domain. There are no entries in Third party web to attribute, no third-party tools to enumerate, and no third-party cookies set. If you expected to see entries here you can fine-tune the first-party domain list with --firstParty.
Calculated using .*sitespeed.* (use --firstParty to configure).
| Content | Header Size | Transfer Size | Content Size | Requests |
|---|---|---|---|---|
| html | 0 b | 6.1 KB | 24.7 KB | 1 |
| css | 0 b | 5.8 KB | 26.7 KB | 1 |
| javascript | 0 b | 1.2 KB | 1.9 KB | 3 |
| image | 0 b | 43.6 KB | 43.2 KB | 3 |
| font | 0 b | 0 b | 0 b | 0 |
| favicon | 0 b | 2.9 KB | 6.4 KB | 1 |
| Total | N/A | 59.6 KB | 102.9 KB | 9 |