Page summary

https://stf.xelta.ai/register

Tested 2026-07-31 13:24:09 using Chrome 150.0.7871.186 (runtime settings)

SummaryWaterfallMetricsRenderingCoachPageXrayCPUThird party

This page is fast to paint, visually stable and follows best practices, but janky to interact with, weak on user privacy and heavy to download.


71 / 100
Coach overall
73 / 100
Performance
91 / 100
Best practice
60 / 100
Privacy

How it loaded →

0 → 7.100 s · median run
Frame at 0 ms
start
Frame at 1700 ms
Largest paint1.700 s
Frame at 3000 ms
3.000 s
Frame at 4400 ms
4.400 s
Frame at 5700 ms
5.700 s
Frame at 7100 ms
Complete7.100 s
333 ms
First Visual Change
3.113 s
Speed Index
6.800 s
Visual Complete 85%
7.100 s
Last Visual Change
TTFB116 msLCP1.268 sTBT2.250 sCLS0.03

What to act on · top recommendations

Avoid using Google Tag Manager.

0 / 100

The page is using Google Tag Manager, this is a performance risk since non-tech users can add JavaScript to your page.

Avoid CPU Long Tasks

0 / 100

The page has 28 CPU long tasks with the total of 4.077 s. The total blocking time is 2.277 s and 3 long tasks before first contentful paint with total time of 550 ms. However the CPU Long Task is depending on the computer/phones actual CPU speed, so you should measure this on the same type of the device that your user is using. Use Geckoprofiler for Firefox or Chromes tracelog to debug your long tasks.

Serve images in modern formats (AVIF, WebP)

0 / 100

The page ships 1 image (out of 1) in JPEG/PNG/GIF without a modern alternative. Wrap them in a <picture> with a <source type="image/avif"> or "image/webp" before the legacy <img>, or serve modern formats from your image pipeline directly. AVIF and WebP usually deliver 25–50% smaller files at the same quality.

Google Web Vitals

min · median · mean · max of 1 run
MetricMinMedianMeanMax
Time To First Byte (TTFB)116 ms116 ms116 ms116 ms
Largest Contentful Paint (LCP)1.268 s1.268 s1.268 s1.268 s
Cumulative Layout Shift (CLS)0.02550.02550.02550.0255

Visual Metrics

min · median · mean · max of 1 run
MetricMinMedianMeanMax
First visual change333 ms333 ms333 ms333 ms
Last visual change7.100 s7.100 s7.100 s7.100 s
Speed index3.113 s3.113 s3.113 s3.113 s
Visual readiness6.767 s6.767 s6.767 s6.767 s
Visual complete 856.800 s6.800 s6.800 s6.800 s
Visual complete 956.800 s6.800 s6.800 s6.800 s
Visual complete 997.100 s7.100 s7.100 s7.100 s

CPU

min · median · mean · max of 1 run
MetricMinMedianMeanMax
Total Blocking Time2.250 s2.250 s2.250 s2.250 s
Max Potential FID585 ms585 ms585 ms585 ms
CPU long tasks 26262626
CPU last long task happens at13.313 s13.313 s13.313 s13.313 s

More metrics

min · median · mean · max of 1 run
MetricMinMedianMeanMax
First paint884 ms884 ms884 ms884 ms
Load event end899 ms899 ms899 ms899 ms

Waterfall

Run 1 SpeedIndex median

First paintFCPLCPDOMContentLoadedDOM interactiveLoadRender-blockingRedirectError

Rendering

Run 1 · median
0.000 s
0s2s4s6s

The red band on the timeline marks when the main thread was busy with long tasks: moments when the page could not paint or respond, however the video looks.

Download video

Filmstrip

69 frames

Use --filmstrip.showAll to show all filmstrips.

Frame at 0 ms
0 ms
0 %
Frame at 400 ms
400 ms
38 %
Frame at 500 ms
500 ms
38 %
Frame at 600 ms
600 ms
38 %
Frame at 700 ms
700 ms
38 %
Frame at 800 ms
800 ms
38 %
Frame at 900 ms
900 ms
38 %
Frame at 1.000 s
1.000 s
38 %
Frame at 1.100 s
1.100 s
38 %
Frame at 1.200 s
1.200 s
38 %
Frame at 1.300 s
1.300 s
52 %
Frame at 1.400 s
1.400 s
53 %
Frame at 1.500 s
1.500 s
54 %
Frame at 1.600 s
1.600 s
53 %
Frame at 1.700 s
1.700 s
53 %
Frame at 1.800 s
1.800 s
53 %
Frame at 1.900 s
1.900 s
53 %
Frame at 2.000 s
2.000 s
53 %
Frame at 2.100 s
2.100 s
53 %
Frame at 2.200 s
2.200 s
53 %
Frame at 2.300 s
2.300 s
53 %
Frame at 2.400 s
2.400 s
53 %
Frame at 2.500 s
2.500 s
53 %
Frame at 2.600 s
2.600 s
53 %
Frame at 2.700 s
2.700 s
53 %
Frame at 2.800 s
2.800 s
53 %
Frame at 2.900 s
2.900 s
53 %
Frame at 3.000 s
3.000 s
53 %
Frame at 3.100 s
3.100 s
53 %
Frame at 3.200 s
3.200 s
53 %
Frame at 3.300 s
3.300 s
53 %
Frame at 3.400 s
3.400 s
53 %
Frame at 3.500 s
3.500 s
53 %
Frame at 3.600 s
3.600 s
54 %
Frame at 3.700 s
3.700 s
54 %
Frame at 3.800 s
3.800 s
54 %
Frame at 3.900 s
3.900 s
54 %
Frame at 4.000 s
4.000 s
54 %
Frame at 4.100 s
4.100 s
54 %
Frame at 4.200 s
4.200 s
54 %
Frame at 4.300 s
4.300 s
54 %
Frame at 4.400 s
4.400 s
61 %
Frame at 4.500 s
4.500 s
61 %
Frame at 4.600 s
4.600 s
61 %
Frame at 4.700 s
4.700 s
61 %
Frame at 4.800 s
4.800 s
63 %
Frame at 4.900 s
4.900 s
63 %
Frame at 5.000 s
5.000 s
63 %
Frame at 5.100 s
5.100 s
63 %
Frame at 5.200 s
5.200 s
63 %
Frame at 5.300 s
5.300 s
63 %
Frame at 5.400 s
5.400 s
64 %
Frame at 5.500 s
5.500 s
64 %
Frame at 5.600 s
5.600 s
75 %
Frame at 5.700 s
5.700 s
75 %
Frame at 5.800 s
5.800 s
75 %
Frame at 5.900 s
5.900 s
75 %
Frame at 6.000 s
6.000 s
76 %
Frame at 6.100 s
6.100 s
76 %
Frame at 6.200 s
6.200 s
76 %
Frame at 6.300 s
6.300 s
77 %
Frame at 6.400 s
6.400 s
77 %
Frame at 6.500 s
6.500 s
77 %
Frame at 6.600 s
6.600 s
77 %
Frame at 6.700 s
6.700 s
77 %
Frame at 6.800 s
6.800 s
96 %
Frame at 6.900 s
6.900 s
96 %
Frame at 7.000 s
7.000 s
96 %
Frame at 7.100 s
7.100 s
100 %

Click a frame to seek the video to that moment. The dot marks frames where the page changed visually.

Why was rendering delayed?

Rendering was not meaningfully delayed. First paint landed at 1.268 s on a 116 ms first byte; the 4 render-blocking requests were done by 266 ms and the remaining ~1.002 s is style and layout work.

Want to see how much CSS style-recalculation work delayed FCP and LCP, plus CPU long tasks? Run with --cpu.

Render blocking requests

4 requests · 76.7 KB

Blocking requests delay both paints: the browser renders nothing until they arrive, so they push First Contentful Paint and everything after it, including the largest paint (LCP). Requests that block the parser inside the body stall everything after them in the document. Load JavaScript with defer or async, and keep non-critical CSS off the critical path with media attributes. Bars show when each request loaded on a clock that runs to the last paint; the gap after the bars is style and layout work. Web fonts are context, not blockers: text renders invisible or in a fallback face while they load, so a font finishing after a paint is the classic reason text changed late.


RequestWhen it loadedTransferDownload
document
stf.xelta.ai · TTFB 116 ms
119 ms
55.5 KB114 ms
css · stf.xelta.ai
109 ms
73.2 KB109 ms
css · stf.xelta.ai
98 ms
777 B98 ms
css · stf.xelta.ai
81 ms
1.4 KB81 ms
css · stf.xelta.ai
73 ms
1.4 KB73 ms
LCP resource
image — downloaded by 777 ms, rendered at 1.268 s
610 ms
4.0 KB610 ms
web font · stf.xelta.ai
75 ms
47.9 KB75 ms
web font · stf.xelta.ai · finished after first paint
loaded after FCP, at 3.865 s
84.0 KB26 ms
0317 ms634 msFCP · LCP 1.268 s

Coach

The coach helps you find performance problems on your web page using web performance best practice rules. And gives you advice on privacy and best practices. Tested using Coach-core version 9.2.1.

Performance advice

73
2 errors11 warnings5 info
warn(0)Avoid using Google Tag Manager.googleTagManager

The page is using Google Tag Manager, this is a performance risk since non-tech users can add JavaScript to your page.

Google Tag Manager makes it possible for non tech users to add scripts to your page that will downgrade performance.

warn(0)Avoid CPU Long TaskslongTasks

The page has 28 CPU long tasks with the total of 4.077 s. The total blocking time is 2.277 s and 3 long tasks before first contentful paint with total time of 550 ms. However the CPU Long Task is depending on the computer/phones actual CPU speed, so you should measure this on the same type of the device that your user is using. Use Geckoprofiler for Firefox or Chromes tracelog to debug your long tasks.

Long CPU tasks locks the thread. To the user this is commonly visible as a "locked up" page where the browser is unable to respond to user input; this is a major source of bad user experience on the web today. However the CPU Long Task is depending on the computer/phones actual CPU speed, so you should measure this on the same type of the device that your user is using. To debug you should use the Chrome timeline log and drag/drop it into devtools or use Firefox Geckoprofiler.

Offenders
  • same-origin-descendant
  • self
  • self
  • same-origin-descendant
  • unknown
  • self
  • self
  • self
  • self
  • self
  • self
  • self
  • self
  • self
  • self
  • self
  • self
  • self
  • self
  • self
  • self
  • self
  • self
  • self
  • self
  • self
  • self
  • self
warn(0)Serve images in modern formats (AVIF, WebP)modernImageFormats

The page ships 1 image (out of 1) in JPEG/PNG/GIF without a modern alternative. Wrap them in a <picture> with a <source type="image/avif"> or "image/webp" before the legacy <img>, or serve modern formats from your image pipeline directly. AVIF and WebP usually deliver 25–50% smaller files at the same quality.

AVIF and WebP routinely deliver 25–50% smaller files than JPEG and PNG at the same perceived quality, and every browser version still under support understands at least one of them. Ship modern formats either through a <picture> element with <source type="image/avif"> / "image/webp" entries in front of the legacy <img>, or directly from a content-negotiating image pipeline that returns AVIF / WebP when the client accepts it. https://web.dev/articles/serve-images-webp

Offenders
warn(0)Avoid extra requests by setting cache headerscacheHeaders

The page has 69 requests that are missing a cache time. Configure a cache time so the browser doesn't need to download them every time. It will save 367.7 kB the next access.

The easiest way to make your page fast is to avoid doing requests to the server. Setting a cache header on your server response will tell the browser that it doesn't need to download the asset again during the configured cache time! Always try to set a cache time if the content doesn't change for every request.

Offenders
warn(0)Total JavaScript size shouldn't be too bigjavascriptSize

The total JavaScript transfer size is 1.2 MB and the uncompressed size is 4 MB. This is totally crazy! There is really room for improvement here.

A lot of JavaScript often means you are downloading more than you need. How complex is the page and what can the user do on the page? Do you use multiple JavaScript frameworks?

Offenders
URLTransferContent
https://www.googletagmanager.com/gtag/js?id=G-CPG3NLBKHP180.8 KB548.2 KB
https://static.cloudflareinsights.com/beacon.min.js/v4513226cdae34746b4dedf0b4dfa099e178179150949611.3 KB30.9 KB
https://stf.xelta.ai/_next/static/chunks/0_ivozyvwwju-.js5.4 KB16.6 KB
https://stf.xelta.ai/cdn-cgi/scripts/7d0fa10a/cloudflare-static/rocket-loader.min.js4.5 KB12.0 KB
https://stf.xelta.ai/_next/static/chunks/07-wcp3u39z0m.js9.5 KB28.1 KB
https://stf.xelta.ai/_next/static/chunks/0em246ik8iufs.js6.6 KB17.3 KB
https://stf.xelta.ai/_next/static/chunks/0rl50cn_p.mxb.js8.1 KB24.6 KB
https://stf.xelta.ai/_next/static/chunks/02i_-8uqc.cxq.js10.9 KB32.9 KB
https://stf.xelta.ai/_next/static/chunks/02fvhu.~ed9tm.js43.3 KB140.7 KB
https://stf.xelta.ai/_next/static/chunks/0i-plj_xxaw8z.js3.6 KB7.1 KB
https://stf.xelta.ai/_next/static/chunks/02kw_xvqe~z8l.js19.5 KB60.2 KB
https://stf.xelta.ai/_next/static/chunks/150ht8n--uthk.js8.8 KB31.3 KB
https://stf.xelta.ai/_next/static/chunks/0fb..7m5fmuc_.js10.0 KB27.9 KB
https://stf.xelta.ai/_next/static/chunks/10.m~_3gpgyia.js15.2 KB58.6 KB
https://stf.xelta.ai/_next/static/chunks/08vhp3.h~c4ew.js16.8 KB58.1 KB
https://stf.xelta.ai/_next/static/chunks/0fg44qzichqiw.js41.6 KB142.6 KB
https://stf.xelta.ai/_next/static/chunks/0kc5itym_8jof.js15.4 KB63.5 KB
https://stf.xelta.ai/_next/static/chunks/026wu3uvh-5u1.js14.6 KB44.3 KB
https://stf.xelta.ai/_next/static/chunks/138ifvdeqtp45.js7.3 KB20.3 KB
https://stf.xelta.ai/_next/static/chunks/0.4x.j3tu010_.js7.4 KB21.3 KB
https://stf.xelta.ai/_next/static/chunks/07.2mioy9yehj.js8.5 KB34.4 KB
https://stf.xelta.ai/_next/static/chunks/08_tnx5bftidk.js11.6 KB33.6 KB
https://stf.xelta.ai/_next/static/chunks/06e425a78ll4h.js19.0 KB62.0 KB
https://stf.xelta.ai/_next/static/chunks/144c003qaudkf.js10.3 KB37.2 KB
https://stf.xelta.ai/_next/static/chunks/13ee4mpgt8ag..js9.6 KB25.7 KB
https://stf.xelta.ai/_next/static/chunks/0zqqteuv74m7v.js10.8 KB29.0 KB
https://stf.xelta.ai/_next/static/chunks/05coj-m~qtcs0.js8.4 KB24.5 KB
https://stf.xelta.ai/_next/static/chunks/turbopack-0wb-1a_pgjvg_.js6.2 KB19.5 KB
https://stf.xelta.ai/_next/static/chunks/15_v~jewnj0mv.js9.9 KB45.5 KB
https://stf.xelta.ai/_next/static/chunks/0y0ijhqmszjlv.js70.4 KB225.2 KB
https://stf.xelta.ai/_next/static/chunks/0vh93s1co9ess.js41.3 KB148.7 KB
https://stf.xelta.ai/_next/static/chunks/16~qkdybp3eg6.js12.8 KB40.4 KB
https://stf.xelta.ai/cdn-cgi/challenge-platform/h/g/scripts/jsd/f70cb37711aa/main.js?10.0 KB21.3 KB
https://connect.facebook.net/en_US/fbevents.js103.8 KB394.5 KB
https://stf.xelta.ai/_next/static/chunks/0w-tb20otfze_.js80.0 KB264.5 KB
https://stf.xelta.ai/_next/static/chunks/0a41ov9xoezkw.js2.6 KB6.2 KB
https://stf.xelta.ai/_next/static/chunks/0oyzftal04ylp.js35.4 KB108.7 KB
https://stf.xelta.ai/_next/static/chunks/0n.g2w7wguhv3.js9.3 KB28.3 KB
https://stf.xelta.ai/_next/static/chunks/0uwndjb.d5fwx.js31.2 KB114.2 KB
https://stf.xelta.ai/_next/static/chunks/0oxjj2cw4l~r1.js3.7 KB7.2 KB
https://stf.xelta.ai/_next/static/chunks/0wqct_4nv9c_d.js9.8 KB35.8 KB
https://stf.xelta.ai/_next/static/chunks/0.xma1o0r_dkq.js5.4 KB16.1 KB
https://stf.xelta.ai/_next/static/chunks/17z~38g-~o5ik.js1.5 KB1.7 KB
https://stf.xelta.ai/_next/static/chunks/0w8qh6-kxgcw8.js8.7 KB29.4 KB
https://connect.facebook.net/signals/config/1941936199799107.../194193619979910761.2 KB262.7 KB
https://stf.xelta.ai/_next/static/chunks/07fg20z5gp6xs.js9.7 KB32.3 KB
https://stf.xelta.ai/_next/static/chunks/0ltjyj-xdme9k.js14.5 KB42.1 KB
https://stf.xelta.ai/_next/static/chunks/0t~dpv9j7jqud.js46.6 KB207.4 KB
https://stf.xelta.ai/_next/static/chunks/10pl5kbxj8r8t.js16.9 KB66.9 KB
https://stf.xelta.ai/_next/static/chunks/05jrkmhtzoscj.js2.5 KB6.8 KB
https://stf.xelta.ai/_next/static/chunks/04x15y-p~uxc6.js6.2 KB19.0 KB
https://stf.xelta.ai/_next/static/chunks/0f9ob20.i3pvm.js4.8 KB10.9 KB
https://stf.xelta.ai/_next/static/chunks/0fy49f-w3rbpb.js3.5 KB8.5 KB
https://stf.xelta.ai/_next/static/chunks/048asxh-q4weh.js1.4 KB2.2 KB
https://stf.xelta.ai/_next/static/chunks/0kgoq_yln6h8_.js1.2 KB1.5 KB
https://stf.xelta.ai/_next/static/chunks/0xnum3gl9kscb.js14.3 KB48.2 KB
https://stf.xelta.ai/_next/static/chunks/13m-jksl80a56.js8.6 KB29.1 KB
warn(0)Total page size shouldn't be too bigpageSize

The page total transfer size is 4.6 MB, which is more than the coach limit of 3 MB. That is really big and you need to make it smaller.

Avoid having pages that have a transfer size over the wire of more than 3 MB (desktop) and 2 MB (mobile) because heavy pages hurt performance and are expensive for users on metered connections. Reference: HTTP Archive median page weight in 2024 was around 2.7 MB desktop / 2.4 MB mobile, so this rule fires when a page is above the modern median.

Offenders
URLTransferContent
https://stf.xelta.ai/register55.5 KB497.2 KB
https://stf.xelta.ai/cdn-cgi/speculation694 B151 B
https://stf.xelta.ai/_next/static/media/83afe278b6a6bb3c-s.p.0q-301v4kxxnr.woff247.9 KB47.3 KB
https://stf.xelta.ai/_next/static/chunks/0bn2cukj3v_dz.css73.2 KB554.9 KB
https://stf.xelta.ai/_next/static/chunks/08ak-dq81l91~.css1.4 KB2.0 KB
https://stf.xelta.ai/_next/static/chunks/0n37s8fmnyjqf.css777 B149 B
https://stf.xelta.ai/_next/static/chunks/0pc6rtedd4gpi.css1.4 KB1.6 KB
https://www.googletagmanager.com/gtag/js?id=G-CPG3NLBKHP180.8 KB548.2 KB
https://stf.xelta.ai/_next/image?url=%2Ficons%2Fmodel.webp&w=1080&q=754.0 KB3.3 KB
https://stf.xelta.ai/_next/image...ta.ai/_next/image22.7 KB22.0 KB
https://static.cloudflareinsights.com/beacon.min.js/v4513226cdae34746b4dedf0b4dfa099e178179150949611.3 KB30.9 KB
https://stf.xelta.ai/_next/image...ta.ai/_next/image9.4 KB8.7 KB
https://stf.xelta.ai/_next/image?url=%2Ficons%2Flogo1.png&w=32&q=751.6 KB924 B
https://stf.xelta.ai/_next/static/chunks/0_ivozyvwwju-.js5.4 KB16.6 KB
https://stf.xelta.ai/cdn-cgi/scripts/7d0fa10a/cloudflare-static/rocket-loader.min.js4.5 KB12.0 KB
https://stf.xelta.ai/manifest.json1.1 KB1.2 KB
https://stf.xelta.ai/_next/static/chunks/07-wcp3u39z0m.js9.5 KB28.1 KB
https://stf.xelta.ai/_next/static/chunks/0em246ik8iufs.js6.6 KB17.3 KB
https://stf.xelta.ai/_next/static/chunks/0rl50cn_p.mxb.js8.1 KB24.6 KB
https://stf.xelta.ai/_next/static/chunks/02i_-8uqc.cxq.js10.9 KB32.9 KB
https://stf.xelta.ai/_next/static/chunks/02fvhu.~ed9tm.js43.3 KB140.7 KB
https://stf.xelta.ai/_next/static/chunks/0i-plj_xxaw8z.js3.6 KB7.1 KB
https://stf.xelta.ai/_next/static/chunks/02kw_xvqe~z8l.js19.5 KB60.2 KB
https://stf.xelta.ai/_next/static/chunks/150ht8n--uthk.js8.8 KB31.3 KB
https://stf.xelta.ai/_next/static/chunks/0fb..7m5fmuc_.js10.0 KB27.9 KB
https://stf.xelta.ai/_next/static/chunks/10.m~_3gpgyia.js15.2 KB58.6 KB
https://stf.xelta.ai/_next/static/chunks/08vhp3.h~c4ew.js16.8 KB58.1 KB
https://stf.xelta.ai/_next/static/chunks/0fg44qzichqiw.js41.6 KB142.6 KB
https://stf.xelta.ai/_next/static/chunks/0kc5itym_8jof.js15.4 KB63.5 KB
https://stf.xelta.ai/_next/static/chunks/026wu3uvh-5u1.js14.6 KB44.3 KB
https://stf.xelta.ai/_next/static/chunks/138ifvdeqtp45.js7.3 KB20.3 KB
https://stf.xelta.ai/_next/static/chunks/0.4x.j3tu010_.js7.4 KB21.3 KB
https://stf.xelta.ai/_next/static/chunks/07.2mioy9yehj.js8.5 KB34.4 KB
https://stf.xelta.ai/_next/static/chunks/08_tnx5bftidk.js11.6 KB33.6 KB
https://stf.xelta.ai/_next/static/chunks/06e425a78ll4h.js19.0 KB62.0 KB
https://stf.xelta.ai/_next/static/chunks/144c003qaudkf.js10.3 KB37.2 KB
https://stf.xelta.ai/_next/static/chunks/13ee4mpgt8ag..js9.6 KB25.7 KB
https://stf.xelta.ai/_next/static/chunks/0zqqteuv74m7v.js10.8 KB29.0 KB
https://stf.xelta.ai/_next/static/chunks/05coj-m~qtcs0.js8.4 KB24.5 KB
https://stf.xelta.ai/_next/static/chunks/turbopack-0wb-1a_pgjvg_.js6.2 KB19.5 KB
https://stf.xelta.ai/_next/static/chunks/15_v~jewnj0mv.js9.9 KB45.5 KB
https://stf.xelta.ai/_next/static/chunks/0y0ijhqmszjlv.js70.4 KB225.2 KB
https://stf.xelta.ai/_next/static/chunks/0vh93s1co9ess.js41.3 KB148.7 KB
https://stf.xelta.ai/_next/static/chunks/16~qkdybp3eg6.js12.8 KB40.4 KB
https://stf.xelta.ai/cdn-cgi/challenge-platform/scripts/jsd/main.jsN/A0 b
https://stf.xelta.ai/cdn-cgi/challenge-platform/h/g/scripts/jsd/f70cb37711aa/main.js?10.0 KB21.3 KB
https://stf.xelta.ai/cdn-cgi/challenge-platform/h/g/jsd/oneshot/f70cb37711aa/0.1.../a23cebfd8cf384c51.9 KB0 b
https://stf.xelta.ai/icons/bg.jpg6.5 KB5.9 KB
https://stf.xelta.ai/_next/image...ta.ai/_next/image6.0 KB6.0 KB
https://stf.xelta.ai/_next/image...ta.ai/_next/image6.2 KB6.2 KB
https://stf.xelta.ai/_next/image...ta.ai/_next/image6.0 KB6.0 KB
https://stf.xelta.ai/_next/image...ta.ai/_next/image6.2 KB6.2 KB
https://stf.xelta.ai/_next/image...ta.ai/_next/image6.1 KB6.1 KB
https://stf.xelta.ai/_next/image...ta.ai/_next/image6.2 KB6.2 KB
https://stf.xelta.ai/_next/image?url=%2Ficons%2Flogo1.png&w=48&q=755.9 KB5.9 KB
https://stf.xelta.ai/_next/image?url=%2Ffooter%2Fandroid.webp&w=96&q=755.9 KB5.9 KB
https://stf.xelta.ai/_next/image?url=%2Ffooter%2Fios.webp&w=96&q=755.9 KB5.9 KB
https://stf.xelta.ai/cdn-cgi/challenge-platform/h/g/jsd/oneshot/f70cb37711aa/0.1.../a23cebfd8cf384c51.9 KB0 b
https://stf.xelta.ai/cdn-cgi/rum?610 B0 b
https://stf.xelta.ai/icons/favicon.ico648.6 KB668.8 KB
https://stf.xelta.ai/icons/apple-touch-icon.png669.8 KB668.8 KB
https://stf.xelta.ai/icons/favicon-32x32.png669.8 KB668.8 KB
https://stf.xelta.ai/icons/favicon-16x16.png669.8 KB668.8 KB
https://connect.facebook.net/en_US/fbevents.js103.8 KB394.5 KB
https://seob.stg.xelta.ai/api/page/%2Fregister907 B677 B
https://devpmt.xelta.ai/api/public/plans1.1 KB977 B
https://devpmt.xelta.ai/api/public/pricing0 b0 b
https://stb.xelta.ai/api/track0 b0 b
https://stf.xelta.ai/_next/static/chunks/0w-tb20otfze_.js80.0 KB264.5 KB
https://stf.xelta.ai/_next/static/chunks/0a41ov9xoezkw.js2.6 KB6.2 KB
https://stf.xelta.ai/_next/static/chunks/0oyzftal04ylp.js35.4 KB108.7 KB
https://stf.xelta.ai/_next/static/chunks/0n.g2w7wguhv3.js9.3 KB28.3 KB
https://stf.xelta.ai/_next/static/chunks/0uwndjb.d5fwx.js31.2 KB114.2 KB
https://stb.xelta.ai/api/track1.1 KB55 B
https://devpmt.xelta.ai/api/public/pricing1.1 KB1.3 KB
https://stf.xelta.ai/_next/static/chunks/0oxjj2cw4l~r1.js3.7 KB7.2 KB
https://www.google-analytics.com/g/collect...ics.com/g/collectN/A0 b
https://analytics.google.com/g/collect...gle.com/g/collectN/A0 b
https://stats.g.doubleclick.net/g/collect...ick.net/g/collect555 B0 b
https://www.google.co.in/ads/ga-audiences.../ads/ga-audiences63 B42 B
https://us-assets.i.posthog.com/array/http://APP_NEXT_PUBLIC_POSTHOG_KEY_PLACEHOLDER/config.jsN/A0 b
https://cms-b.stg2.xelta.ai/api/maintenance807 B43 B
https://telemetry.matchbestsoftware.online/faro/0 b0 b
https://telemetry.matchbestsoftware.online/faro/286 B2 B
https://devpmt.xelta.ai/api/public/pricing637 B1.3 KB
https://stf.xelta.ai/_next/static/chunks/0wqct_4nv9c_d.js9.8 KB35.8 KB
https://stf.xelta.ai/_next/static/chunks/0.xma1o0r_dkq.js5.4 KB16.1 KB
https://stf.xelta.ai/_next/static/chunks/17z~38g-~o5ik.js1.5 KB1.7 KB
https://stf.xelta.ai/_next/static/chunks/0w8qh6-kxgcw8.js8.7 KB29.4 KB
https://stb.xelta.ai/api/models/latest1.7 KB2.0 KB
https://stf.xelta.ai/ai-cinematic-video-generator?_rsc=YHJgCYC7z7ItAmEk5.1 KB6.0 KB
https://stf.xelta.ai/ai-filmmaking-tools?_rsc=YHJgCYC7z7ItAmEk4.3 KB6.0 KB
https://stf.xelta.ai/ai-video-generator?_rsc=YHJgCYC7z7ItAmEk4.4 KB6.0 KB
https://stf.xelta.ai/ai-image-generator?_rsc=YHJgCYC7z7ItAmEk5.1 KB6.0 KB
https://stf.xelta.ai/contact?_rsc=YHJgCYC7z7ItAmEk4.4 KB5.9 KB
https://stf.xelta.ai/terms-conditions?_rsc=YHJgCYC7z7ItAmEk4.3 KB5.9 KB
https://stf.xelta.ai/explore?_rsc=YHJgCYC7z7ItAmEk5.0 KB5.9 KB
https://stf.xelta.ai/_next/static/media/1bffadaabf893a1e-s.16ipb6fqu393i.woff284.0 KB83.3 KB
https://stf.xelta.ai/_next/image...ta.ai/_next/image6.2 KB6.2 KB
https://stf.xelta.ai/_next/image?url=%2Flogin%2F1.png&w=1920&q=755.8 KB5.8 KB
https://stf.xelta.ai/_next/image?url=%2Flogin%2F2.png&w=1920&q=755.8 KB5.8 KB
https://stf.xelta.ai/_next/image?url=%2Flogin%2F3.png&w=1920&q=755.8 KB5.8 KB
https://stf.xelta.ai/_next/image?url=%2Flogin%2F4.png&w=1920&q=755.8 KB5.8 KB
https://telemetry.matchbestsoftware.online/faro/286 B2 B
https://connect.facebook.net/signals/config/1941936199799107.../194193619979910761.2 KB262.7 KB
https://stf.xelta.ai/_next/image...ta.ai/_next/image6.2 KB6.2 KB
https://cms-b.stg2.xelta.ai/api/announcements?placement=APP_TOP1.2 KB492 B
https://telemetry.matchbestsoftware.online/faro/286 B2 B
https://us-assets.i.posthog.com/array/http://APP_NEXT_PUBLIC_POSTHOG_KEY_PLACEHOLDER/config62 B0 b
https://stb.xelta.ai/api/models/categories?limit=66.6 KB27.7 KB
https://stf.xelta.ai/_next/static/chunks/07fg20z5gp6xs.js9.7 KB32.3 KB
https://stf.xelta.ai/_next/static/chunks/0ltjyj-xdme9k.js14.5 KB42.1 KB
https://stf.xelta.ai/_next/static/chunks/0t~dpv9j7jqud.js46.6 KB207.4 KB
https://us.i.posthog.com/flags/?v=2&compression=base64496 B174 B
https://telemetry.matchbestsoftware.online/faro/286 B2 B
https://stf.xelta.ai/_next/static/chunks/10pl5kbxj8r8t.js16.9 KB66.9 KB
https://stf.xelta.ai/_next/static/chunks/05jrkmhtzoscj.js2.5 KB6.8 KB
https://stf.xelta.ai/_next/static/chunks/04x15y-p~uxc6.js6.2 KB19.0 KB
https://stf.xelta.ai/_next/static/chunks/0f9ob20.i3pvm.js4.8 KB10.9 KB
https://stf.xelta.ai/_next/static/chunks/0fy49f-w3rbpb.js3.5 KB8.5 KB
https://stf.xelta.ai/_next/static/chunks/048asxh-q4weh.js1.4 KB2.2 KB
https://telemetry.matchbestsoftware.online/faro/286 B2 B
https://stf.xelta.ai/_next/static/chunks/0kgoq_yln6h8_.js1.2 KB1.5 KB
https://stf.xelta.ai/_next/static/chunks/0xnum3gl9kscb.js14.3 KB48.2 KB
https://stf.xelta.ai/_next/static/chunks/13m-jksl80a56.js8.6 KB29.1 KB
https://stf.xelta.ai/_next/image...ta.ai/_next/image6.2 KB6.2 KB
https://stf.xelta.ai/_next/image?url=%2Fchatboard%2Favtar.png&w=96&q=755.9 KB5.9 KB
https://stb.xelta.ai/api/models/image_generation/gpt-image-1-5-workflow2.6 KB5.1 KB
https://stb.xelta.ai/api/models/top-popular2.3 KB4.5 KB
https://stb.xelta.ai/api/community/posts?limit=5015.4 KB48.8 KB
https://stf.xelta.ai/_next/image...ta.ai/_next/image6.1 KB6.1 KB
https://telemetry.matchbestsoftware.online/faro/286 B2 B
https://stf.xelta.ai/_next/image...ta.ai/_next/image6.1 KB6.1 KB
https://telemetry.matchbestsoftware.online/faro/286 B2 B
https://stf.xelta.ai/_next/image...ta.ai/_next/image6.2 KB6.2 KB
https://www.google-analytics.com/g/collect...ics.com/g/collect57 B0 b
https://analytics.google.com/g/collect...gle.com/g/collect57 B0 b
https://telemetry.matchbestsoftware.online/faro/286 B2 B
https://stf.xelta.ai/_next/image...ta.ai/_next/image6.2 KB6.2 KB
https://stf.xelta.ai/_next/image?url=%2Fpilot-landing%2F1.jpeg&w=256&q=755.9 KB5.9 KB
https://telemetry.matchbestsoftware.online/faro/286 B2 B
https://stf.xelta.ai/_next/image...ta.ai/_next/image6.2 KB6.2 KB
error(0)Avoid missing and error requestsresponseOk

The page has 58 error responses. The page has 2 responses with code 401. The page has 54 responses with code 403. The page has 2 responses with code 404.

Your page should never request assets that return a 400 or 500 error. These requests are never cached. If that happens something is broken. Please fix it.

Offenders
warn(50)Total CSS size shouldn't be too bigcssSize

The total CSS transfer size is 78.5 kB and uncompressed size is 572 kB. That is big and the CSS could most probably be smaller.

Delivering a massive amount of CSS to the browser is not the best thing you can do, because it means more work for the browser when parsing the CSS against the HTML and that makes the rendering slower. Try to send only the CSS that is used on that page. And make sure to remove CSS rules when they aren't used anymore.

Offenders
URLTransferContent
https://stf.xelta.ai/_next/static/chunks/0bn2cukj3v_dz.css73.2 KB554.9 KB
https://stf.xelta.ai/_next/static/chunks/08ak-dq81l91~.css1.4 KB2.0 KB
https://stf.xelta.ai/_next/static/chunks/0n37s8fmnyjqf.css777 B149 B
https://stf.xelta.ai/_next/static/chunks/0pc6rtedd4gpi.css1.4 KB1.6 KB
infoThe favicon should be small and cacheablefavicon

The favicon size is 664.1 kB bytes. That's quite big, can you make it smaller?

It is easy to make the favicon big but please avoid doing that, because every browser will then perform an unnecessarily large download. And make sure the cache headers are set for a long time for the favicon. It is easy to miss since it's another content type.

Offenders
warn(50)Total image size shouldn't be too bigimageSize

The page total image size is 2.1 MB. It's really big. Is the page using the right format for the images? Can they be lazy loaded? Are they compressed as good as they can be? Make them smaller by using https://imageoptim.com/.

Avoid having too many large images on the page. The images will not affect the first paint of the page, but it will eat bandwidth for the user.

infoAdd decoding="async" to non-critical imagesdecodingAsync

The page has 28 images (out of 94) without a decoding hint. Add decoding="async" to non-critical images so the browser can decode them off the main thread.

Setting decoding="async" on an <img> tells the browser it can decode the image off the main thread, which keeps the page responsive to user interactions while images are being processed. The default ("auto") leaves the choice to the browser. https://developer.mozilla.org/en-US/docs/Web/HTML/Element/img#decoding

Offenders
infoAvoid too many fontsfewFonts

The page has 2 font requests. Do you really need them? What value does the fonts give the user?

How many fonts do you need on a page for the user to get the message? Fonts can slow down the rendering of content, try to avoid loading too many of them because worst case it can make the text invisible until they are loaded (FOIT—flash of invisible text), best case they will flicker the text content when they arrive.

Offenders
infoLong cache headers is goodcacheHeadersLong
warn(90)Avoid doing redirectsassetsRedirects

The page has 1 redirect. 1 of the redirects are from the base domain, please fix them!

A redirect is one extra step for the user to download the asset. Avoid that if you want to be fast. Redirects are even more of a showstopper on mobile.

Offenders
warn(90)Always compress text contentcompressAssets

The page has 1 request that are served uncompressed. You could save a lot of bytes by sending them compressed instead.

In the early days of the Internet there were browsers that didn't support compressing (gzipping) text content. They do now. Make sure you compress HTML, JSON, JavaScript, CSS and SVG. It will save bytes for the user; making the page load faster and use less bandwith.

Offenders
URLTransferContent
https://stf.xelta.ai/cdn-cgi/challenge-platform/h/g/scripts/jsd/f70cb37711aa/main.js?10.0 KB21.3 KB
infoMake each CSS response smalloptimalCssSize

https://stf.xelta.ai/_next/static/chunks/0bn2cukj3v_dz.css size is 74.9 kB (74913) and that is bigger than the limit of 25 kB. Try to keep each CSS response under 25 kB.

Render-blocking CSS holds up the first paint until it has fully downloaded, parsed and applied, so smaller CSS files mean a faster start. Split your CSS into a small critical bundle inlined or eagerly loaded, with the rest lazy-loaded.

Offenders
URLTransferContent
https://stf.xelta.ai/_next/static/chunks/0bn2cukj3v_dz.css73.2 KB554.9 KB
warn(90)Don't use private headers on static contentprivateAssets

The page has 1 request with private headers. Make sure that the assets really should be private and only used by one user. Otherwise, make it cacheable for everyone.

If you set private headers on content, that means that the content are specific for that user. Static content should be able to be cached and used by everyone. Avoid setting the cache header to private.

Offenders
error(98)Avoid using incorrect mime typesmimeTypes

The page has 2 misconfigured mime types.

It's not a great idea to let browsers guess content types (content sniffing), in some cases it can actually be a security risk.

Offenders

Best practice advice

91
1 warning2 info
infoAvoid unnecessary headersunnecessaryHeaders

There are 1 response that sets a p3p header. There are 3 responses that sets both a max-age and expires header. There are 6 responses that sets a pragma no-cache header (that is a request header). There are 166 responses that sets a server header.

Do not send headers that you don't need. We look for p3p, cache-control and max-age, pragma, server and x-frame-options headers. Have a look at Andrew Betts - Headers for Hackers talk as a guide https://www.youtube.com/watch?v=k92ZbrY815c or read https://www.fastly.com/blog/headers-we-dont-want.

Offenders
warn(50)Avoid too many third party requeststhirdParty

The page do 15% requests to third party domains (25 requests and 370.1 kB). First party is 143 requests and 4.2 MB. The regex .*xelta.* was used to calculate first/third party requests.

Do not load most of your content from third party URLs.

infoDo not send too long headerslongHeaders

https://stf.xelta.ai.../a23cebfd8cf384c5 has a header cf-chl-out-s that is 1713 characters long. https://stf.xelta.ai.../a23cebfd8cf384c5 has a header cf-chl-out-s that is 1713 characters long. https://connect.face...en_US/fbevents.js has a header content-security-policy that is 1344 characters long. https://connect.face...en_US/fbevents.js has a header content-security-policy-report-only that is 1415 characters long. https://connect.face...en_US/fbevents.js has a header permissions-policy that is 874 characters long. https://connect.face.../1941936199799107 has a header content-security-policy that is 1344 characters long. https://connect.face.../1941936199799107 has a header content-security-policy-report-only that is 1415 characters long. https://connect.face.../1941936199799107 has a header permissions-policy that is 874 characters long.

Do not send response headers that are too long.

Offenders

Privacy advice

60
1 error6 warnings2 info
warn(0)Avoid using Google Analyticsga

The page is using Google Analytics meaning you share your users private information with Google. You should use analytics that care about user privacy, something like https://matomo.org.

Google Analytics share private user information with Google that your user hasn't agreed on sharing.

warn(0)Avoid embedding services from surveillance capitalist companiessurveillance

The page embeds 3 resources from companies that profit from user surveillance. Consider privacy-respecting alternatives.

Embedding scripts or iframes from companies whose business model is surveillance capitalism (Google, Facebook, etc.) leaks detailed user data on every page view, often before the user has had a chance to consent. See https://en.wikipedia.org/wiki/Surveillance_capitalism for background. Prefer privacy-respecting alternatives where possible.

Offenders
warn(0)Use a strict Content-Security-Policy header to mitigate cross-site scripting (XSS) attacks.contentSecurityPolicyHeader

Set a Content-Security-Policy header to mitigate cross-site scripting attacks. You can start with a Content-Security-Policy-Report-Only header, which only reports violations rather than blocking them.

A Content-Security-Policy response header tells the browser which sources of script, style, and other content are allowed. The most effective form is a strict CSP using nonces or hashes together with strict-dynamic; the worst is a missing header, with unsafe-inline and unsafe-eval close behind. https://web.dev/articles/strict-csp

Offenders
infoSet a Cross-Origin-Embedder-Policy header so cross-origin subresources opt in to being embedded.crossOriginEmbedderPolicyHeader

Set a Cross-Origin-Embedder-Policy header (typically require-corp or credentialless) on the document response to control cross-origin embedding.

Cross-Origin-Embedder-Policy (COEP) makes the page refuse to load cross-origin subresources unless they explicitly opt in via CORP or CORS. Together with Cross-Origin-Opener-Policy it puts the page in a cross-origin isolated context, which mitigates cross-window side-channel attacks (Spectre) and unlocks high-resolution timers and SharedArrayBuffer. https://developer.mozilla.org/en-US/docs/Web/HTTP/Headers/Cross-Origin-Embedder-Policy

Offenders
warn(0)Set a Cross-Origin-Opener-Policy header to isolate the page from cross-origin windows.crossOriginOpenerPolicyHeader

Set a Cross-Origin-Opener-Policy header (typically same-origin) on the document response to isolate the page from cross-origin windows.

Cross-Origin-Opener-Policy (COOP) lets a page sever its window-group ties to cross-origin documents that opened it or that it opens. Together with Cross-Origin-Embedder-Policy it puts the page in a cross-origin isolated context, which mitigates cross-window side-channel attacks (Spectre) and unlocks high-resolution timers and SharedArrayBuffer. https://developer.mozilla.org/en-US/docs/Web/HTTP/Headers/Cross-Origin-Opener-Policy

Offenders
infoSet a Cross-Origin-Resource-Policy header to limit who may embed the page.crossOriginResourcePolicyHeader

Set a Cross-Origin-Resource-Policy header (same-origin, same-site or cross-origin) on the document response to limit who may embed it.

Cross-Origin-Resource-Policy (CORP) is a per-response opt-in that tells the browser which origins are allowed to embed the resource. It blocks cross-origin or cross-site no-cors embedding (img, script, iframe, etc.) and is one of the building blocks of cross-origin isolation. https://developer.mozilla.org/en-US/docs/Web/HTTP/Headers/Cross-Origin-Resource-Policy

Offenders
error(0)Serve all responses on HTTPS (when you are on HTTPS)mixedContent

You need to serve all responses on HTTPS. The page have 2 responses using HTTP. That is a privacy and security risk.

You need to make sure that if you are on HTTPS, all responses are on HTTPS so that the content served are secured.

Offenders
warn(0)Set a Permissions-Policy header to control which browser features the page can use.permissionsPolicyHeader

Set a Permissions-Policy header to control which browser features the page can use.

The Permissions-Policy response header (the successor to Feature-Policy) lets a site explicitly opt in or out of powerful browser features such as camera, microphone, geolocation, payment and clipboard. Setting a strict policy reduces the attack surface and limits what embedded third parties can do. https://developer.mozilla.org/en-US/docs/Web/HTTP/Headers/Permissions-Policy

Offenders
warn(0)Do not share user data with third parties.thirdPartyPrivacy

The page has 6% requests that are 3rd party (10 requests with a size of 366.4 kB). The page also have request to companies that harvest data from users and do not respect users privacy (see https://en.wikipedia.org/wiki/Surveillance_capitalism). The page do 1 tag-manager request and uses 1 tag-manager tool. The page do 9 survelliance requests and uses 5 survelliance tools. The page do 9 surveillance requests and uses 5 surveillance tools. The page do 2 utility requests and uses 2 utility tools. The page do 2 social requests and uses 1 social tool. The page do 4 analytics requests and uses 1 analytics tool. The page do 1 ad request and uses 1 ad tool.

Using third party requests shares user information with that third party. Please avoid that! The project https://github.com/patrickhulce/third-party-web is used to categorize first/third party requests.

Offenders

Page info

A snapshot of what the browser actually built for this page: the document, how big and deep the DOM tree is and what it kept in storage. Big, deep trees are slower to style and lay out, so the counts Chrome warns about carry a flag.

Page info

Document

What the page says it is and how large it rendered.

TitleRegisterThe document title, shown in the browser tab and used by search results.
Layout viewport1365 × 620 pxThe width the page laid out at, and the full height of the rendered document.

DOM structure

How much markup the browser has to build, style and lay out.

DOM elements2,410Very large, slows layout and styleTotal HTML elements. Fewer means less for the browser to style, lay out and paint.
Avg DOM depth12How deeply elements are nested on average.
Max DOM depth21The deepest nesting on the page. Deep branches cost more style recalculation.
Iframes1Embedded documents. Each is a separate page the browser loads and renders.
Script tags87Number of script elements. More scripts usually means more main-thread work.

Storage and connection

What the page stored on the client, and the network it was tested on.

Local storage52.9 KBData the page saved in localStorage, kept across visits.
Session storage293 BData kept in sessionStorage for this tab session only.
Connection type4GWhat the Network Information API reported for the test connection.

Resource hints

2 hints
dns-prefetch
  • https://media.xelta.ai/
preconnect
  • https://media.xelta.ai/

Technologies used to build the page

Data collected using Coach-core version 9.2.1. With updated code from Webappanalyzer 2026-05-04. Use --browsertime.firefox.includeResponseBodies html or --browsertime.chrome.includeResponseBodies html to help Wappalyzer find more information about technologies used.

Detected technologies

6 technologies
  • Node.jsConfidence100
    Programming languages
  • EnvoyConfidence100
    Reverse proxies
  • ExpressConfidence100
    Web frameworksWeb servers
  • HSTSConfidence100
    Security
  • CloudflareConfidence100
    CDN
  • HTTP/3Confidence100
    Miscellaneous

Third-party tools

16 tools

Data collected using Third Party Web version 0.29.2.

Tag-manager
  • Google Tag Manager
Survelliance
  • Google Tag Manager
  • Facebook
  • Google Analytics
  • Google/Doubleclick Ads
  • Other Google APIs/SDKs
Surveillance
  • Google Tag Manager
  • Facebook
  • Google Analytics
  • Google/Doubleclick Ads
  • Other Google APIs/SDKs
Utility
  • Cloudflare
  • Other Google APIs/SDKs
Social
  • Facebook
Analytics
  • Google Analytics
Ad
  • Google/Doubleclick Ads

Data from run 1

Visual Metrics

Visual milestones

all times from navigation start
Speed Index3.11 show quickly the page looked done
First Visual Change0.33 sfirst paint reaches the screen
Last Visual Change7.10 sscreen stops changing · 6.77 s after first
0.33 sFirst Visual Change
Visual Complete 85% · Visual Complete 95%6.80 s
Visual Complete 99% · Last Visual Change7.10 s
Visual Readiness6.77 s· first to last change
02.0 s4.0 s6.0 s
Content milestones
Perception index
Visual progress
Visual progress at 0 s0.0s
Visual progress at 1.3 s1.3s
Visual progress at 2.2 s2.2s
Visual progress at 3.2 s3.2s
Visual progress at 4.2 s4.2s
Visual progress at 5.2 s5.2s
Visual progress at 6.1 s6.1s
Visual progress at 7.1 s7.1s
FCP1.27s
LCP1.27s
VC856.80s
Long tasks
0.0s1.4s2.8s4.3s5.7s7.1s

Google Web Vitals

from run 1

Largest Contentful Paint

When the page main content is rendered, collected via the Largest Contentful Paint API. Read more about Largest Contentful Paint.
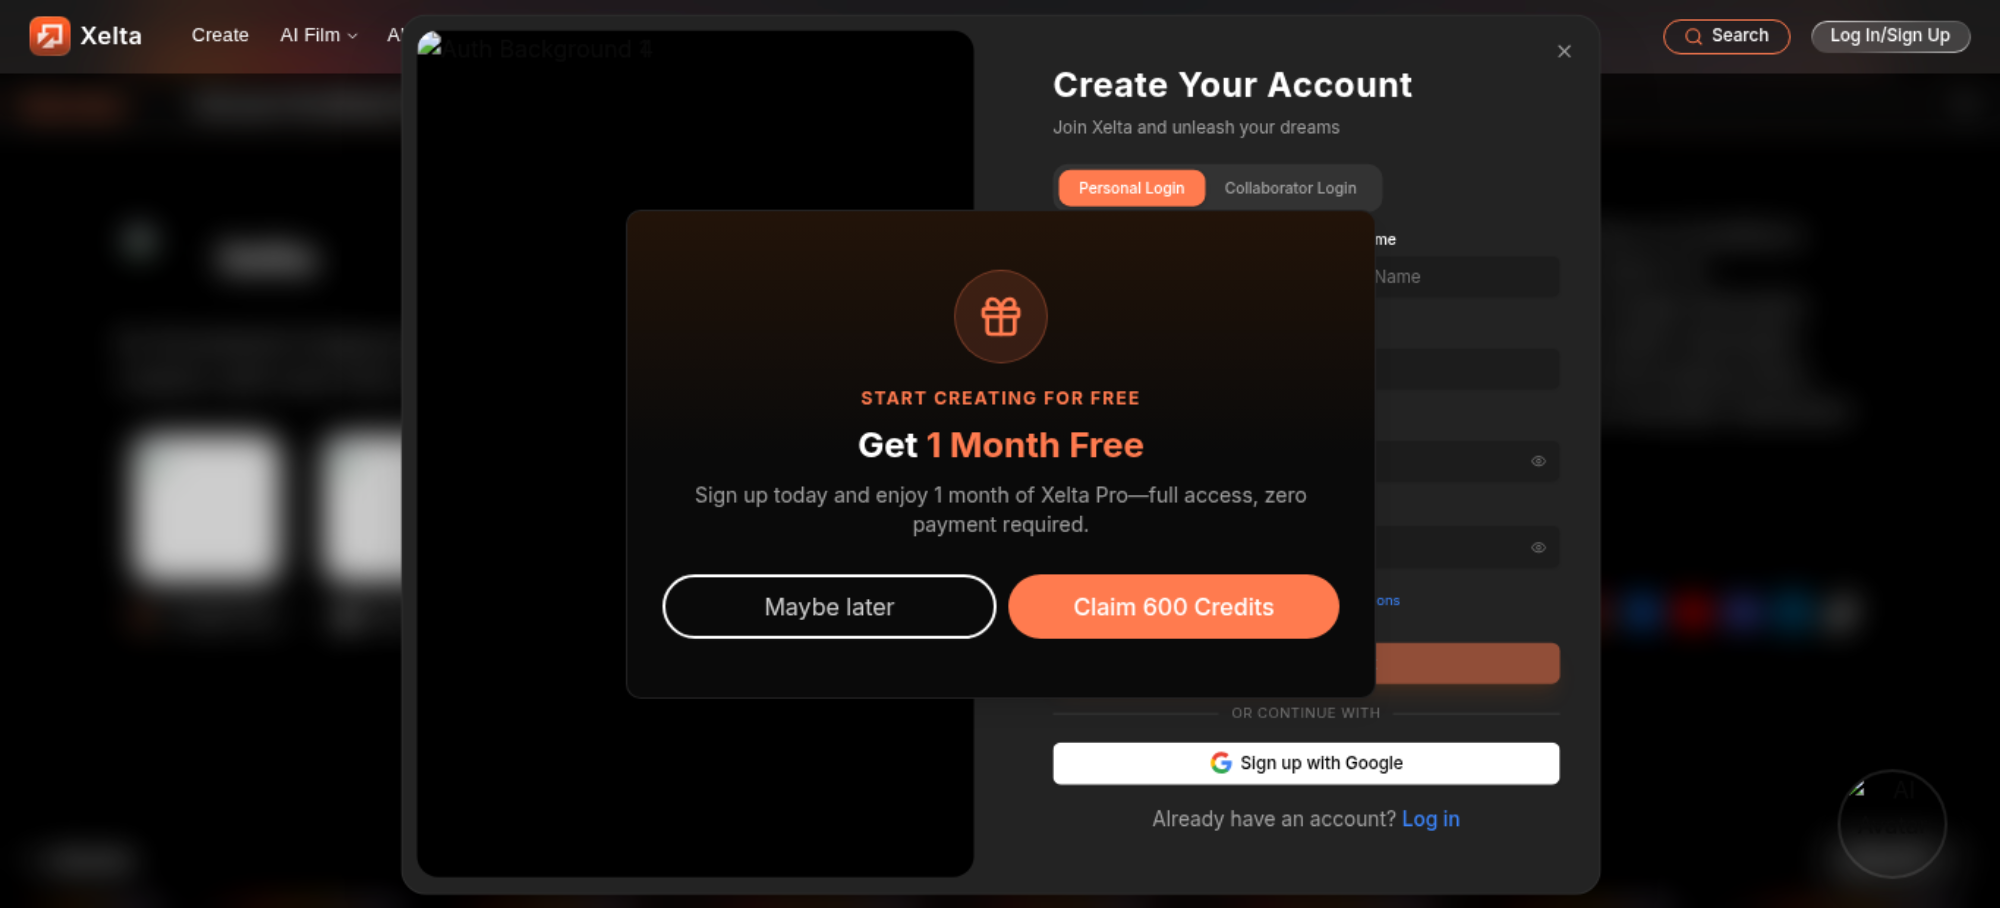
1.268 sLCP render time

Phase breakdown

  • TTFB116 ms
  • Resource load delay32 ms
  • Resource load duration639 ms
  • Element render delay481 ms

Element

Size (w × h)
333485
URL
https://stf.xelta.ai...ta.ai/_next/image
Load time
988 ms
LCP

The LCP element is highlighted in the screenshot. If nothing is highlighted the element was removed before the screenshot or the LCP API couldn't find it.

The Largest Contentful Paint API matched this image:

LCP element

Cumulative Layout Shift

How much the page's content shifts as it loads, collected via the Cumulative Layout Shift API.

0.026cumulative layout shift score

One shift is 100% of your 0.026 CLS. footer moved at 6.250 s. Reserve space for whatever renders into that spot, a fixed height or an aspect-ratio box, so later content stops pushing the page around.

Elements that shifted

Worst first, showing shifts of 0.01 and up. Each percentage is that shift's exact share of the score.

  • 0.026
    100% of CLSshifted at 6.250 s
    <footer class="relative w-full bg-black text-white pt-14 pb-8 px-6 sm:px-10 md:px-16 lg:px-20 overflow-hidden font-sans border-t border-neutral-900" data-aria-hidden="true" aria-hidden="true">
    body > div#app-root > footer
Layout shift

Elements that shifted by more than 0.01 are highlighted in the screenshot. If an element shifted outside the viewport, it won't appear here. Check the video or filmstrip to see the shift.

Browser Metrics

Navigation Timing
Extra timings

Server timings

Timing data the server chose to expose through Server-Timing response headers on the main document — typically backend time, cache status or experiment flags.

Server timings

4 entries
NameDurationDescription
cfCacheStatus0 msDYNAMIC
cfEdge12 ms
cfOrigin72 ms
cfExtPri0 ms

Custom metrics collected through JavaScript

There are no custom configured scripts.

Extra metrics collected using scripting

There are no custom extra metrics from scripting.

PageXray

How the page is built.

HTTP versionH3
Total requests168
Total domains15
Transfer size4.4 MB
Content size8.0 MB
Missing compression1
Cookies20 third-party

Main document

status 200 · 0 redirects

https://stf.xelta.ai/register

HeaderValue
alt-svch3=":443"; ma=86400
cache-controls-maxage=50, stale-while-revalidate=31535950
cf-cache-statusDYNAMIC
cf-raya23cebfd8cf384c5-BOM
content-encodingzstd
content-typetext/html; charset=utf-8
dateFri, 31 Jul 2026 13:24:10 GMT
expect-ctmax-age=86400, enforce
nel{"report_to":"cf-nel","success_fraction":0.0,"max_age":604800}
priorityu=0,i
referrer-policysame-origin strict-origin-when-cross-origin
report-to{"group":"cf-nel","max_age":604800,"endpoints":[{"url":"https://a.nel.cloudflare.com/report/v4?s=TjnQQP9gBrmttw4L6cdZAEBokRa%2BoqQBdtCk%2FWPOZqDc%2FK0%2FV5TQA5g2jUaH3O0lpPUVxharjwfB9wDNIBRw8PlYzKOr8kyCVrm7R2Ijag8aGMqnihnOe44ymv6Sb%2Fg%3D"}]}
servercloudflare
server-timingcfCacheStatus;desc="DYNAMIC" cfEdge;dur=12,cfOrigin;dur=72 cfExtPri
speculation-rules"/cdn-cgi/speculation"
strict-transport-securitymax-age=31536000; includeSubDomains; preload
varyrsc, next-router-state-tree, next-router-prefetch, next-router-segment-prefetch, Accept-Encoding
x-content-type-optionsnosniff
x-frame-optionsSAMEORIGIN
x-nextjs-cacheSTALE
x-nextjs-prerender1 1
x-nextjs-stale-time300
x-xss-protection1; mode=block

Response codes

200
9053.6%
202
116.5%
204
84.8%
302
10.6%
401
21.2%
403
5432.1%
404
21.2%

Largest assets on the page (by transfer size)

Top 20 of 168

Requests and sizes per content type

9 types

Transfer size4.1 MB

  • image49.3%
  • javascript27.7%
  • favicon15.6%
  • font3.2%
  • css1.8%
  • html1.3%
  • json0.85%
  • plain0.19%
  • other0.02%

Content size7.7 MB

  • javascript49.2%
  • image26.0%
  • favicon8.5%
  • css7.1%
  • html6.3%
  • font1.7%
  • json1.2%
  • other0.00%
  • plain0.00%

Requests109

  • javascript52.3%
  • plain18.3%
  • json11.0%
  • image8.3%
  • css3.7%
  • other2.8%
  • font1.8%
  • html0.92%
  • favicon0.92%
ContentHeader SizeTransfer SizeContent SizeRequests
html0 b55.5 KB497.2 KB1
css0 b76.7 KB558.6 KB4
javascript0 b1.1 MB3.8 MB57
image0 b2.0 MB2.0 MB9
font0 b131.9 KB130.6 KB2
favicon0 b648.6 KB668.8 KB1
other0 b694 B151 B3
json0 b35.6 KB93.9 KB12
plain0 b8.1 KB22 B20
Total0 b4.1 MB7.7 MB109

Data per domain

15 domains
DomainTotal download timeTransfer SizeContent SizeRequests
stf.xelta.ai13.802 s4.0 MB6.7 MB129
www.googletagmanager.com373 ms180.8 KB548.2 KB1
static.cloudflareinsights.com85 ms11.3 KB30.9 KB1
connect.facebook.net422 ms165.0 KB657.3 KB2
seob.stg.xelta.ai85 ms907 B677 B1
devpmt.xelta.ai2.268 s2.9 KB3.5 KB4
stb.xelta.ai526 ms29.7 KB88.1 KB7
www.google-analytics.com373 ms56 B0 b2
analytics.google.com367 ms56 B0 b2
stats.g.doubleclick.net107 ms555 B0 b1
www.google.co.in115 ms63 B42 B1
us-assets.i.posthog.com89 ms61 B0 b2
cms-b.stg2.xelta.ai804 ms2.0 KB535 B2
telemetry.matchbestsoftware.online154 ms3.1 KB22 B12
us.i.posthog.com852 ms496 B174 B1

Expires & last-modified statistics

typeminmedianmax
Expires0 seconds0 seconds1 year
Last modified2 minutes1 day6 weeks

Requests loaded after onLoad event

121 requests

Includes requests done after load event end.

ContentTransfer SizeRequests
html0 b0
css0 b0
javascript483.0 KB24
image2.0 MB5
font84.0 KB1
favicon648.6 KB1
plain6.2 KB19
json34.4 KB11
other0 b2
Total3.5 MB121

Requests loaded after onContentLoad

124 requests

Includes requests done after DOM content loaded.

ContentTransfer SizeRequests
html0 b0
css0 b0
javascript492.9 KB25
image2.0 MB5
font84.0 KB1
favicon648.6 KB1
plain8.1 KB20
json34.4 KB11
other0 b2
Total3.5 MB124

CPU

https://stf.xelta.ai/_next/static/chunks/0y0ijhqmszjlv.js is responsible for 53% of blocking time
1145 ms of 2179 ms total. Defer it, replace it with a lighter alternative, or move its work off the main thread to recover most of your TBT.
Get deeper CPU insight with one extra run
Run with --enableProfileRun to see where main-thread time went, blocking time and CPU cost per script, module and function, forced reflows and frame stability. The data is collected in one extra run, so the timing metrics of your measured runs stay untouched.

Long tasks

Tasks ≥ 50 ms blocking the main thread, collected via the Long Task API.

TBT2.250 s
Max potential input delay585 ms
Total long tasks26
Total time3.950 s
Last task at13.313 s
Before first paint190 ms1 task
Before FCP550 ms3 tasks
Before LCP550 ms3 tasks
After load3.760 s25 tasks

Long Animation Frames

A long animation frame (LOAF) is a frame that took ≥ 50 ms from input to the next paint. The part beyond the threshold is blocking time, the number that hurts Interaction to Next Paint and Total Blocking Time. Break long tasks up (scheduler.yield(), smaller chunks) or move the work off the main thread. Read more about the Long Animation Frames API.

Long animation frames68showing the 10 with the most blocking time
Blocking time3.183 sacross all long frames — what hurts INP and TBT
Forced style & layout737.4 msscripts reading layout mid-frame
Blocking before LCP307.2 msdelaying the largest paint — fix these first
Blocking after load2.431 safter the load event — didn't delay page load
Input waiting3 framesa real interaction was delayed (INP)

What to fix first

ScriptFramesTime runningBlocking (share by run time)Forced style & layoutTriggered by
0y0ijhqmszjlv.js71.625 s1.145 s718.6 msevent handler
fbevents.js3rd party1262.4 ms258 msscript tag
js3rd party1220 ms138.5 msscript tag
main.js1180.5 ms136.8 ms8.2 msscript tag
0_ivozyvwwju-.js1191.3 ms128 msscript tag
0rl50cn_p.mxb.js1222.9 ms92.3 mspromise callback
0w-tb20otfze_.js3147.5 ms73.8 msevent handler, timer or animation callback, promise callback
19419361997991073rd party1150.6 ms69.8 msscript tag
rocket-loader.min.js340.5 ms39.3 ms5 msevent handler
0oyzftal04ylp.js343.9 ms30.5 mstimer or animation callback
0t~dpv9j7jqud.js143.6 ms18.1 msscript tag
0uwndjb.d5fwx.js127.6 ms12.8 mstimer or animation callback
02i_-8uqc.cxq.js213.4 ms10 ms5.6 mstimer or animation callback, script tag
0em246ik8iufs.js110.7 ms9.6 mstimer or animation callback
13m-jksl80a56.js113.3 ms5 msscript tag
10pl5kbxj8r8t.js110 ms4.1 msscript tag
138ifvdeqtp45.js15.7 ms3.8 msscript tag
turbopack-0wb-1a_pgjvg_.js15 ms3.3 msscript tag

A frame's blocking time is split between its scripts by their share of the frame's work, capped at each script's own run time — blocking from work no script owns (HTML parsing, browser internals) stays unattributed. The per-script blocking view below uses the same attribution.

Long animation frame #1 · 864.6 msat 4.372 s · after load
input was waitingblocking 663.7 ms
  • Scripts & other work736.7 ms
  • Animation callbacks127.7 ms
  • Style & layout0.2 ms
  • Render0 ms
6 scripts ran during this frame · forced style & layout 316.8 ms
Ran for
6.9 ms
Started by
PerformanceObserverCallback
How it started
timer or animation callback
Position in source
character 40270 into the file (locate it via DevTools → Performance → the Long Animation Frames track)
Ran for
8.6 ms
Started by
MessagePort.onmessage
How it started
event handler
Source function
z
Position in source
character 7855 into the file (locate it via DevTools → Performance → the Long Animation Frames track)
Ran for
25.4 ms
Started by
SCRIPT[src="https://us-assets.i.posthog.com/array/http://APP_NEXT_PUBLIC_POSTHOG_KEY_PLACEHOLDER/config.js"].onerror
How it started
event handler
Position in source
character 41857 into the file (locate it via DevTools → Performance → the Long Animation Frames track)
Ran for
11.1 ms
Started by
#document.onerror
How it started
event handler
Source function
c
Position in source
character 9348 into the file (locate it via DevTools → Performance → the Long Animation Frames track)
Ran for
585.9 ms
Forced style and layout
316.8 ms
Started by
MessagePort.onmessage
How it started
event handler
Source function
z
Position in source
character 7855 into the file (locate it via DevTools → Performance → the Long Animation Frames track)
Ran for
10.7 ms
Started by
FrameRequestCallback
How it started
timer or animation callback
Position in source
character 9651 into the file (locate it via DevTools → Performance → the Long Animation Frames track)
Long animation frame #2 · 435.2 msat 3.465 s · after load
input was waitingblocking 346.8 ms
  • Scripts & other work407.6 ms
  • Animation callbacks27.4 ms
  • Style & layout0.2 ms
  • Render0 ms
3 scripts ran during this frame · forced style & layout 293.2 ms
Ran for
23.4 ms
Started by
MessagePort.onmessage
How it started
event handler
Source function
z
Position in source
character 7855 into the file (locate it via DevTools → Performance → the Long Animation Frames track)
Ran for
369.2 ms
Forced style and layout
287.6 ms
Started by
MessagePort.onmessage
How it started
event handler
Source function
z
Position in source
character 7855 into the file (locate it via DevTools → Performance → the Long Animation Frames track)
Ran for
5.9 ms
Forced style and layout
5.6 ms
Started by
FrameRequestCallback
How it started
timer or animation callback
Source function
r
Position in source
character 26039 into the file (locate it via DevTools → Performance → the Long Animation Frames track)
Long animation frame #3 · 434.8 msat 3.918 s · after load
blocking 320.9 ms
  • Scripts & other work326.4 ms
  • Animation callbacks106 ms
  • Style & layout2.4 ms
  • Render0 ms
4 scripts ran during this frame · forced style & layout 5 ms
Ran for
12.5 ms
Started by
MessagePort.onmessage
How it started
event handler
Source function
z
Position in source
character 7855 into the file (locate it via DevTools → Performance → the Long Animation Frames track)
Ran for
15.7 ms
Started by
TimerHandler:setInterval
How it started
timer or animation callback
Position in source
character 93928 into the file (locate it via DevTools → Performance → the Long Animation Frames track)
fbevents.js3rd party
Ran for
262.4 ms
How it started
script tag
Ran for
5.2 ms
Forced style and layout
5 ms
Started by
DOMWindow.onscroll
How it started
event handler
Source function
c
Position in source
character 9348 into the file (locate it via DevTools → Performance → the Long Animation Frames track)
Long animation frame #4 · 638.8 msat 5.614 s · after load
blocking 257.4 ms
  • Scripts & other work621.7 ms
  • Animation callbacks17 ms
  • Style & layout0.1 ms
  • Render0 ms
11 scripts ran during this frame
Ran for
115.3 ms
Started by
TimerHandler:setTimeout
How it started
timer or animation callback
Position in source
character 190395 into the file (locate it via DevTools → Performance → the Long Animation Frames track)
Ran for
16.1 ms
Started by
TimerHandler:setInterval
How it started
timer or animation callback
Position in source
character 93928 into the file (locate it via DevTools → Performance → the Long Animation Frames track)
Ran for
222.9 ms
Started by
Response.json.then
How it started
promise callback
Position in source
character 9705 into the file (locate it via DevTools → Performance → the Long Animation Frames track)
Ran for
5.2 ms
Started by
TimerHandler:setInterval
How it started
timer or animation callback
Position in source
character 93928 into the file (locate it via DevTools → Performance → the Long Animation Frames track)
Ran for
43.6 ms
How it started
script tag
Ran for
10 ms
How it started
script tag
Ran for
5.1 ms
Started by
MessagePort.onmessage
How it started
event handler
Source function
z
Position in source
character 7855 into the file (locate it via DevTools → Performance → the Long Animation Frames track)
Ran for
5.9 ms
Started by
MessagePort.onmessage
How it started
event handler
Source function
z
Position in source
character 7855 into the file (locate it via DevTools → Performance → the Long Animation Frames track)
Ran for
12.3 ms
Started by
MessagePort.onmessage
How it started
event handler
Source function
z
Position in source
character 7855 into the file (locate it via DevTools → Performance → the Long Animation Frames track)
Ran for
10.5 ms
Started by
MessagePort.onmessage
How it started
event handler
Source function
z
Position in source
character 7855 into the file (locate it via DevTools → Performance → the Long Animation Frames track)
Ran for
5 ms
Started by
MessagePort.onmessage
How it started
event handler
Source function
z
Position in source
character 7855 into the file (locate it via DevTools → Performance → the Long Animation Frames track)
Long animation frame #5 · 321.6 msat 2.248 s · after load
blocking 200.9 ms
  • Scripts & other work319.1 ms
  • Animation callbacks0.6 ms
  • Style & layout1.9 ms
  • Render0 ms
3 scripts ran during this frame · forced style & layout 2 ms
Ran for
9.9 ms
Forced style and layout
2 ms
Started by
MessagePort.onmessage
How it started
event handler
Source function
z
Position in source
character 7855 into the file (locate it via DevTools → Performance → the Long Animation Frames track)
Ran for
78.1 ms
Started by
MessagePort.onmessage
How it started
event handler
Source function
z
Position in source
character 7855 into the file (locate it via DevTools → Performance → the Long Animation Frames track)
js3rd party
Ran for
220 ms
How it started
script tag
Long animation frame #6 · 544.6 msat 6.286 s · after load
blocking 192 ms
  • Scripts & other work512.9 ms
  • Animation callbacks31.1 ms
  • Style & layout0.6 ms
  • Render0 ms
22 scripts ran during this frame · forced style & layout 112.2 ms
Ran for
5.8 ms
Started by
MessagePort.onmessage
How it started
event handler
Source function
z
Position in source
character 7855 into the file (locate it via DevTools → Performance → the Long Animation Frames track)
Ran for
13.3 ms
How it started
script tag
Ran for
5.1 ms
Started by
MessagePort.onmessage
How it started
event handler
Source function
z
Position in source
character 7855 into the file (locate it via DevTools → Performance → the Long Animation Frames track)
Ran for
5.8 ms
Started by
MessagePort.onmessage
How it started
event handler
Source function
z
Position in source
character 7855 into the file (locate it via DevTools → Performance → the Long Animation Frames track)
Ran for
7.3 ms
Started by
MessagePort.onmessage
How it started
event handler
Source function
z
Position in source
character 7855 into the file (locate it via DevTools → Performance → the Long Animation Frames track)
Ran for
10 ms
Started by
MessagePort.onmessage
How it started
event handler
Source function
z
Position in source
character 7855 into the file (locate it via DevTools → Performance → the Long Animation Frames track)
Ran for
6.6 ms
Started by
MessagePort.onmessage
How it started
event handler
Source function
z
Position in source
character 7855 into the file (locate it via DevTools → Performance → the Long Animation Frames track)
Ran for
6.7 ms
Started by
MessagePort.onmessage
How it started
event handler
Source function
z
Position in source
character 7855 into the file (locate it via DevTools → Performance → the Long Animation Frames track)
Ran for
6 ms
Started by
MessagePort.onmessage
How it started
event handler
Source function
z
Position in source
character 7855 into the file (locate it via DevTools → Performance → the Long Animation Frames track)
Ran for
19.6 ms
Started by
MessagePort.onmessage
How it started
event handler
Source function
z
Position in source
character 7855 into the file (locate it via DevTools → Performance → the Long Animation Frames track)
Ran for
9.6 ms
Started by
MessagePort.onmessage
How it started
event handler
Source function
z
Position in source
character 7855 into the file (locate it via DevTools → Performance → the Long Animation Frames track)
Ran for
20.7 ms
Started by
MessagePort.onmessage
How it started
event handler
Source function
z
Position in source
character 7855 into the file (locate it via DevTools → Performance → the Long Animation Frames track)
Ran for
6.7 ms
Started by
MessagePort.onmessage
How it started
event handler
Source function
z
Position in source
character 7855 into the file (locate it via DevTools → Performance → the Long Animation Frames track)
Ran for
5.8 ms
Started by
MessagePort.onmessage
How it started
event handler
Source function
z
Position in source
character 7855 into the file (locate it via DevTools → Performance → the Long Animation Frames track)
Ran for
6.4 ms
Started by
MessagePort.onmessage
How it started
event handler
Source function
z
Position in source
character 7855 into the file (locate it via DevTools → Performance → the Long Animation Frames track)
Ran for
28.6 ms
Started by
MessagePort.onmessage
How it started
event handler
Source function
z
Position in source
character 7855 into the file (locate it via DevTools → Performance → the Long Animation Frames track)
Ran for
11.1 ms
Started by
MessagePort.onmessage
How it started
event handler
Source function
z
Position in source
character 7855 into the file (locate it via DevTools → Performance → the Long Animation Frames track)
Ran for
5.1 ms
Started by
MessagePort.onmessage
How it started
event handler
Source function
z
Position in source
character 7855 into the file (locate it via DevTools → Performance → the Long Animation Frames track)
Ran for
193.7 ms
Forced style and layout
111.7 ms
Started by
MessagePort.onmessage
How it started
event handler
Source function
z
Position in source
character 7855 into the file (locate it via DevTools → Performance → the Long Animation Frames track)
Ran for
7 ms
Forced style and layout
0.5 ms
Started by
MessagePort.onmessage
How it started
event handler
Source function
z
Position in source
character 7855 into the file (locate it via DevTools → Performance → the Long Animation Frames track)
Ran for
66.6 ms
Started by
MessagePort.onmessage
How it started
event handler
Source function
z
Position in source
character 7855 into the file (locate it via DevTools → Performance → the Long Animation Frames track)
Ran for
8.4 ms
Started by
MessagePort.onmessage
How it started
event handler
Source function
z
Position in source
character 7855 into the file (locate it via DevTools → Performance → the Long Animation Frames track)
Long animation frame #7 · 270 msat 1.071 s · before LCP
input was waitingblocking 165.6 ms
  • Scripts & other work247.4 ms
  • Animation callbacks22.5 ms
  • Style & layout0.1 ms
  • Render0 ms
4 scripts ran during this frame
Ran for
5 ms
How it started
script tag
Ran for
5.7 ms
Queued before running
5.5 ms
How it started
script tag
Ran for
7.5 ms
How it started
script tag
Ran for
191.3 ms
How it started
script tag
Long animation frame #8 · 200.9 msat 1.349 s · after load
blocking 142.9 ms
  • Scripts & other work188.5 ms
  • Animation callbacks12.3 ms
  • Style & layout0.1 ms
  • Render0 ms
1 script ran during this frame · forced style & layout 8.2 ms
Ran for
180.5 ms
Forced style and layout
8.2 ms
How it started
script tag
Ran in
an iframe inside this page
Long animation frame #9 · 193 msat 868.5 ms · before LCP
blocking 141.6 ms
  • Scripts & other work34.9 ms
  • Animation callbacks1.3 ms
  • Style & layout156.8 ms
  • Render0 ms
1 script ran during this frame
Ran for
24.2 ms
Started by
DOMWindow.onload
How it started
event handler
Position in source
character 8077 into the file (locate it via DevTools → Performance → the Long Animation Frames track)
Long animation frame #10 · 337.1 msat 5.261 s · after load
blocking 140.5 ms
  • Scripts & other work303 ms
  • Animation callbacks33.6 ms
  • Style & layout0.5 ms
  • Render0 ms
4 scripts ran during this frame
Ran for
150.6 ms
How it started
script tag
Ran for
27.6 ms
Started by
TimerHandler:setTimeout
How it started
timer or animation callback
Position in source
character 81439 into the file (locate it via DevTools → Performance → the Long Animation Frames track)
Ran for
6.8 ms
Started by
Response.text.then
How it started
promise callback
Position in source
character 96754 into the file (locate it via DevTools → Performance → the Long Animation Frames track)
Ran for
55.6 ms
Started by
MessagePort.onmessage
How it started
event handler
Source function
z
Position in source
character 7855 into the file (locate it via DevTools → Performance → the Long Animation Frames track)

Blocking time per script (browser-reported)

How much each script blocked the main thread, derived from the Long Animation Frame API. Each frame's blocking time is split between its scripts by their share of the frame's work, capped at each script's own run time — blocking from work no script owns (HTML parsing, browser internals) is not attributed (older data credits the script that started the frame). The closest answer to "which script should I fix to improve TBT" the platform exposes.

Forced layout per script

Each long animation frame reports how much time each script spent forcing synchronous style and layout, i.e. JavaScript reading layout-triggering properties mid-execution. Same actionable answer as forced reflows above but measured directly by the browser instead of inferred from the trace.

Third party

Third party requests categorised by Third party web version 0.29.2.

Third-party requests19
Tools6
Categories6

Categories

6 categories

Requests by category19

  • survelliance9 req · 5 tools47.4%
  • analytics4 req · 1 tool21.1%
  • utility2 req · 2 tools10.5%
  • social2 req · 1 tool10.5%
  • tag-manager1 req · 1 tool5.3%
  • ad1 req · 1 tool5.3%

Third party requests and tools

6 categories
tag-managerGoogle Tag Manager1 requests · 1 tool
survellianceGoogle Tag ManagerFacebookGoogle Analytics+ 2 more9 requests · 5 tools
utilityCloudflareOther Google APIs/SDKs2 requests · 2 tools
socialFacebook2 requests · 1 tool
analyticsGoogle Analytics4 requests · 1 tool
adGoogle/Doubleclick Ads1 requests · 1 tool

Unmatched third party domains

3 domains

Domains that didn't match any tool in Third party web. If you are sure they are third party domains, please do a PR to that project. You can also fine tune the list using --firstParty.

  • us-assets.i.posthog.com
  • telemetry.matchbestsoftware.online
  • us.i.posthog.com

First party vs third party

143 first · 25 third party

Transfer size4.4 MB

  • First party4.0 MB91.9%
  • Third party361.4 KB8.1%

Content size8.0 MB

  • First party6.8 MB84.9%
  • Third party1.2 MB15.1%

Requests168

  • First party14385.1%
  • Third party2514.9%

First party requests and sizes per content type

143 requests

Calculated using .*xelta.* (use --firstParty to configure).

ContentHeader SizeTransfer SizeContent SizeRequests
html0 b55.5 KB497.2 KB1
css0 b76.7 KB558.6 KB4
javascript0 b795.2 KB2.6 MB53
image0 b2.0 MB2.0 MB8
font0 b131.9 KB130.6 KB2
favicon0 b648.6 KB668.8 KB1
other0 b694 B151 B3
json0 b35.6 KB93.9 KB12
plain0 b4.4 KB0 b3
TotalN/A4.0 MB6.8 MB143

Third party requests and sizes per content type

25 requests
ContentHeader SizeTransfer SizeContent SizeRequests
html0 b0 b0 b0
css0 b0 b0 b0
javascript0 b357.1 KB1.2 MB4
image0 b63 B42 B1
font0 b0 b0 b0
favicon0 b0 b0 b0
plain0 b3.7 KB22 B17
TotalN/A361.4 KB1.2 MB25